We feel privileged to have backed the Founders of over 100 software businesses at Seed to Series A over the years.
Despite 2023 being one of the gloomiest years in venture in recent memory, we continued to be active, with new investments into Social Value Portal, Risk Ledger, Centuro Global, HowNow, Kuano, Envoke-Demos, Huler, FourJaw Manufacturing Analytics, StudentCrowd, Shopblocks, HR DataHub and Productive Machines along with follow on investments into Adludio, Forensic Analytics Ltd, Thalia, WorkBuzz, mindtrace.ai, OneUp Sales, Looper Insights, Netacea, ART Health Solutions, Luminous Group, Pivigo, Bimsense, Tribosonics, Distil.ai, Slingshot Simulations, Iventis, Invincibles Studio, Melius Cyber, Cyacomb, Administrate, equiwatt, Haystack, and Little Journey.
We have also been fortunate to build enduring long term partnerships with Founders right through to exit – including: nDreams (2014-2023), Evotix (2017-2023), Lineup Systems (2011-2023), Behaviour – UK North (2020-2023), Horsefly (2013-2023), Airship (2019-2022), AeroParker (2014-2022), Kumulos (2018-2022), Immersive Interactive (2013-2022), Azzure IT Ltd (2018-2022), IN-PART (we have a new home!) (2016-2021), Genba Digital (2016-2021), Collabco (2014-2021), Clear Review – an Advanced company (2018-2020), Refract (2016-2020) and SS&C Blue Prism (2004-2019).
It’s not all about the numbers…
An obvious but necessary up front caveat, but for us financial metrics only form part of our decisioning assessment. Market size, how the product/service fits within the future state of that market, product related metrics and our holistic assessment of Founder capabilities all play a big part.
Enough, show me the metrics..!
The below sets out the key financial metrics we care about to evaluate all SaaS businesses and why.
At core, the below ultimately provide a gauge of how quickly and efficiently a business is growing, how likely customers are to stick around, and therefore how strong the future cash flows are likely to be.
Product market fit
Product market fit is a highly subjective and imprecise concept, however fast growth and a stable customer base is the starting point for demonstrating it has been achieved
Metric 1 – ARR
How is it calculated? Total live monthly recurring revenue * 12
Why is it important? We’re pretty sure this needs no introduction. ARR is the most appropriate leading indicator of commercial traction in a SaaS business, as it is a predictor of future revenue.
Commercial traction is important to demonstrate a solution has been built and is solving a real problem customers are willing to pay for.
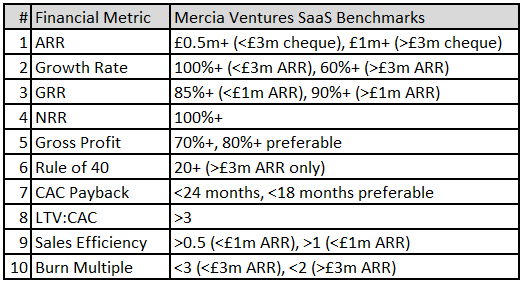
What does good look like for us? £500k+ (<£3m Seed round), £1m+ (>£3m Series A round)
Metric 2 – Annual growth rate
How is it calculated? Current live monthly recurring revenue / monthly recurring revenue 12 months ago
Why is it important? Fast growth demonstrates product/market fit and strong execution by the team. As companies scale it becomes increasingly difficult to maintain growth rates achieved in the early days from a smaller base. Therefore strong growth at the £1-5m ARR stage is important to demonstrate the business will be able to maintain it once operating at scale and hit later stage metrics like rule of 40 (see metric 6 below).
What does good look like for Mercia Ventures? 100%+ (<£3m ARR), 60%+ (>£3m ARR). This is less than typical for many funds, but we prioritise discipline and predictability over out and out growth.
Do customers love the product
NRR above 100% will increase the annuity value of the customer base, and is another strong indicator of product market fit
Metric 3 – Gross revenue retention (GRR)
How is it calculated? (ARR 12 months ago – ARR contraction & churn in last 12 months) / ARR 12 months ago
Why is it important? High GRR close to 100% demonstrates low levels of churn and a happy customer base. Drivers of this include a great customer product experience, strong account management, good competitive differentiation, and generally delivering on customer expectations. Sustained low levels of churn significantly improve a SaaS business’ ability to scale sustainably. It is much more efficient to retain existing customers and acquire new logos, rather than experiencing churn and acquiring at a higher rate.
What does good look like for Mercia Ventures? 85%+ (<£1m ARR), 90%+ (>£1m ARR)
Metric 4 – Net Revenue Retention (NRR)
How is it calculated? (ARR 12 months ago + ARR expansion/upsell/reactivation in last 12 months – ARR contraction/churn in last 12 months) / ARR 12 months ago
Why is it important? NRR takes into account increasing contract values over time, as well as the ability to retain customers (which alone is GRR above). Strong NRR can indicate a number of things – customers are satisfied with the product; the product has good pricing power relative to typically increasing competition; and the product is sticky and “mission critical” to customer operations.
What does good look like for Mercia Ventures? 100%+
Is the business model fundamentally sustainable
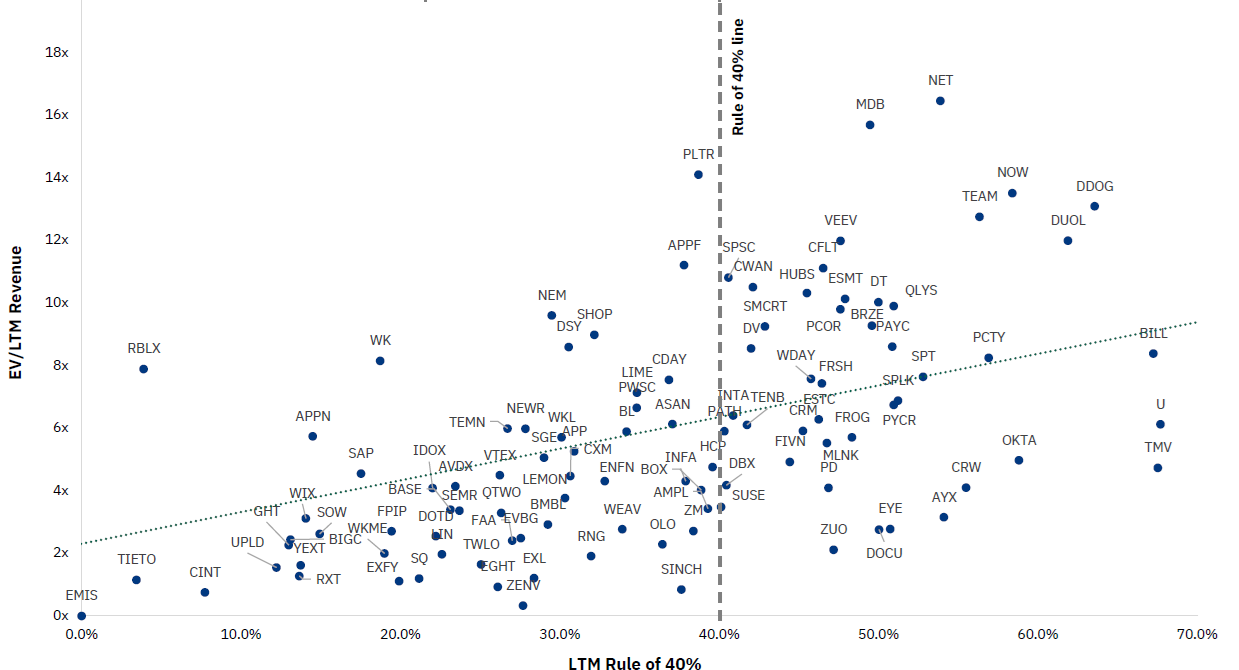
Rule of 40 performance significantly impacts valuation for publicly listed SaaS (Source: GP Bullhound Q3-23 software sector update, Capital IQ)
Rule of 40 provides a rule of thumb against which the financial efficiency of SaaS businesses are assessed
Metric 5 – Gross profit margin
How is it calculated? Last 12 months revenue / LTM Gross profit
Why is it important? SaaS is one of the greatest business models to exist, with the cost to serve each new customer typically being very low (or in some cases near zero). While it is common for some SaaS businesses to have a service offering alongside the core product, high gross profit margins >70% indicate this reliance on services to deliver the offering is limited, which will be more scalable and more highly valued in the longer run.
What does good look like for Mercia Ventures? 70%+ as a baseline minimum, 80%+ preferable
Metric 6 – Rule of 40
How is it calculated? YoY growth rate of ARR + EBITDA margin
Why is it important? Only relevant at scale, Rule of 40 (or is it 50 now…?) provides a rule of thumb against which the financial efficiency of SaaS businesses are assessed both in the private and public markets. Those who achieve this consistently attract a valuation premium. While more in vogue today than in the heady days of 2021, the Rule of 40 has always been a sensible cold towel metric, providing a gauge of both how quickly and efficiently a business is growing, and accounts for the trade off between the two.
What does good look like for Mercia Ventures? Not relevant below £3m ARR, 20%+ above £3m ARR
Can the company scale sustainably – crunching the numbers
Comparing LTV to CAC compares how much it costs to acquire a customer against how much that customer is worth
Metric 7 – CAC Payback
How is it calculated? (Last 12 months sales and marketing costs £ / Last 12 months # of new customers won) / (average contract value £ * gross margin %)
Why is it important? Similar to the more conventional investment concept of payback period, CAC payback measures how long it takes a new customer to cover the costs of “acquiring” them. The longer the payback period, the higher the risk the customer churns before any incremental value has been captured. CAC payback should also be considered in the context of contract terms (annual vs multi-year, monthly vs annual payment) and between an Enterprise and SME customer bases, however this is a bigger topic. A key thing to note is that CAC payback is calculated based on gross profit rather than revenue.
What does good look like for Mercia Ventures? <24 months, <18 months preferable
Metric 8 – LTV:CAC
How is it calculated? Lifetime Value = ACV * gross margin % (1/(1-GRR %); CAC = (Last 12 months sales & marketing costs £ / # of new customers won in last 12 months)
Why is it important? Lifetime value measures how much a customer is worth to the business, and is a function of how much a customer is contributing at the gross margin level, and for how long. This provides a guide as to how much can and should be spent on customer acquisition. An LTV:CAC ratio above 3 suggests that while in early years the business may be loss making due to the initial CAC payback period, the underlying business model is sustainable and the business will make a profit once operating at scale. Churn is the most pivotal variable in this equation – an annual churn rate of 5% implies customers will stick around for 20 years, whereas 20% is 5 years. For forecasting it can be better to assume a typical customer life (e.g. 5-10 years) until you have multiple years of churn performance data to support. This metric is more applicable above £1m ARR.
What does good look like for Mercia Ventures? >3x (above £1m ARR)
Metric 9 – Sales efficiency / magic number
How is it calculated? Net new ARR in last 12 months £ / sales and marketing costs in last 12 months £
Why is it important? A shorter term measure of the profitability of the underlying business, sales efficiency is measured by comparing for every £ spent on sales and marketing with how much net new ARR is generated as a result. In earlier stage SaaS businesses below £1m ARR, lower sales efficiency figures below 1 can be more common through investment ahead of growth (e.g. early marketing and sales hires). However, as the business scales sales efficiency >1 demonstrates of combination of successfully targeting the ideal customer profile (ICP), strong competitive differentiation, and strong articulation of the value proposition in a way that resonates with customers.
What does good look like for Mercia Ventures? >0.5 below £1m ARR, >1 above £1m ARR
Metric 10 – Burn multiple
How is it calculated? Last 12 months cash burn £ / Last 12 months net new ARR added £
Why is it important? Provides a simple view over capital efficiency of the business as a whole, taking into account the growth rate of the business, gross margins, and growth in the overhead base. A low burn multiple indicates a combination of high gross margins, low churn rates and strong sales efficiency. Ultimately the burn rate is a reflection of the company’s appetite to consume capital in pursuit of top line growth, and this will massively differ between different Founders and Investors. As a generalisation following global increases in interest rates, Founders may find a lower burn multiple will increase the probability of fundraising success in 2024
What does good look like for Mercia Ventures? <3 (<£3m ARR), <2 (>£3m ARR)
Summary – what does good look like
Reflections
These metrics are not hard and fast and only form part of our assessment of SaaS businesses. Performance tends to move around a lot even as companies scale well beyond £10m ARR. We also look at these metrics in conjunction with one another – for example a business with an exceptional growth rate may have lower sales efficiency while investing for growth, particularly if sales cycles are >12 months. As such, we may (and do) invest in businesses not hitting all metrics, while similarly a business hitting all metrics does not guarantee investment. Aside from these, our relationship and partnership with a founding team underpins everything and will be more relevant than any short-term metric performance. So, whether or not you are not currently raising funds for your SaaS business, or hitting all of the above financial metrics, please do reach out.
We would love to chat.
Mercia Ventures is a Seed to Series A venture capital firm backing some of the most promising early-stage UK based companies operating across the software, life sciences, deep tech and consumer sectors. We invest £1-10m in equity and have no fixed investment horizon, rather we believe in enduring partnerships and supporting founders along the entire journey.